1Q 2025 Market Commentary
07/01/2025
Dear Fellow Investors,
When markets decline people get nervous. We are hard-wired to feel the pain of losing money more intensely than the pleasure of gaining it. We shared in our 2019 Annual Letter many of these behavioral traits that make us all uniquely human, flawed, and emotional when it comes to making financial decisions. A significant part of our job is to provide the behavioral coaching needed for investors to weather near-term concerns and reap the rewards of long-term investing. Often times, our coaching comes down to putting things into perspective.
At the time of this writing, the market (S&P 500) has entered a correction, down 10% from its previous peak, and it’s all over the news. But do you remember what happened between January 3, 2022, and January 19, 2024? During that two-year period, the market spent 60% of the time more than 10% below its January 2022 peak, hitting its lowest point on October 12, 2022, at 25.4% below the peak. Do you remember what all the headlines were during this two-year stretch? The market was also down more than 10% from its previous peak in early 2020, late 2018, early 2018, early 2016, and late 2015. Do you remember what all the causes were? Odds are you don’t. These various worries show up in the volatility of the market. If you look at the past 45 years you’ll find there’s an average intra-year decline of just over 14%.
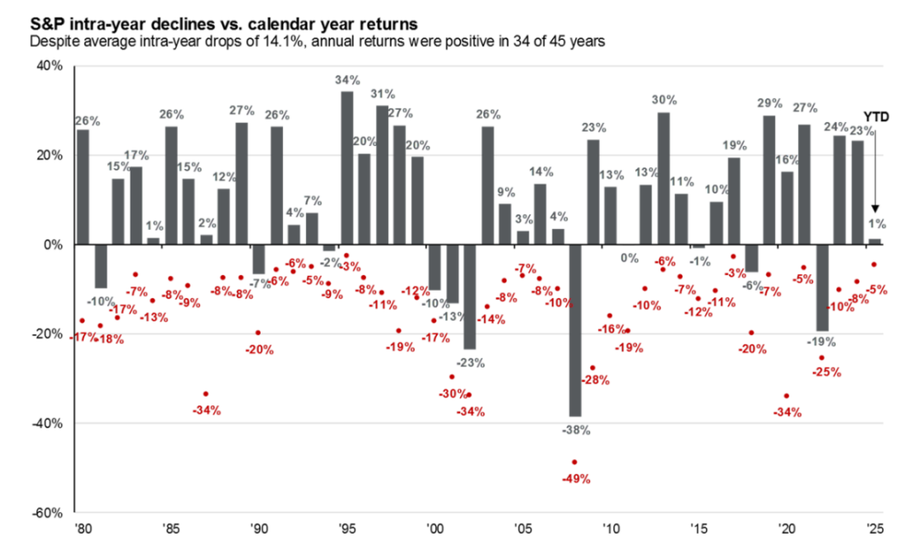
Source: JP Morgan
Narratives come and go. Some are more easily remembered like COVID, wars, and financial crises, while others fade into obscurity. However, at the time they’re happening they all seem to be the most important event taking place in the world. Recently we’ve heard about inflation, interest rates, supply chains, elections, and now we’re back to tariffs and trade wars. While they always cause uncertainty this eventually fades as plans come into focus.
So what is the plan? In our opinion the current administration’s plan is pretty much what the plan was during the first term:
- Focus on manufacturing to help strengthen supply chains and provide quality jobs
- Incentivize both foreign and domestic companies to build in the US
- Reduce taxes to free up capital for investment
- Reduce regulation to allow entrepreneurs to work and build fast
- Move the economy towards private players and away from elevated government spending and involvement
Will the plan work? This will only be known in hindsight. A trade war that leads to higher prices would obviously be negative. However, if hard-line posturing proves to be a negotiating tactic that leads to a reworked trade deal, that might lead to lower prices and would be positive. Cutting revenue streams via individual and corporate taxes would imply growing deficits which would be negative. However, if cuts to government expenditures are greater than the lost revenue, that would mean lower deficits which would be positive. Re-shoring manufacturing might lead to inflation given higher labor costs which would be negative. However, the
benefits to local communities from having quality jobs that spur demand for housing, community services, and give people a sense of purpose might outweigh higher product costs and be more beneficial to economic growth – certainly positive.
Recall in Q3 2021 we highlighted the main pieces of the prior administration’s plan given the proposed infrastructure and tax packages. That time period caused much fear and angst for many investors as well but our message never waivered. We have tremendous faith in the checks and balances of our systems that tends to squash more extreme proposals. Our economy is loaded with talent and has proven to be much more resilient than most give it credit for. The framework created by our founding fathers to allow innovation, creativity, and competition to flourish is alive and well. Given that our country has gone through numerous regime changes related to monetary, fiscal, and political policies we don’t believe this time will be any different.
Economics is an attempt to measure a complex web of behaviors and actions. There are multiple levers being pushed and pulled and only time will tell the extent of their success or failure. Attempting to guess at these outcomes while they’re in the works is not a prudent investment strategy. The fact that we have the opportunity to own a piece of numerous outstanding businesses operating in today’s economy is grossly underappreciated. When you’re fortunate enough to find some of these outstanding businesses it’s typically foolish to sell any of them. Keeping emotions in check and exercising patience remain superpowers - use them wisely.
As always, we welcome your feedback and would love to talk about these and any other topics that may be important to you. We thank you for your continued confidence and the opportunity to manage your investments. We take very seriously our responsibility. Montecito Investment Portfolio’s Mission: To provide diversified, disciplined long-term investment solutions, service and guidance to help our clients achieve, and maintain, their “Financial Independence”.
Sincerely,
Blake Todd, CWS Jarrett Perez, CFA
Senior Vice President, Financial Advisor, Vice President, Financial Advisor,
Portfolio Manager Portfolio Manager
[email protected] [email protected]
Disclaimers
All quoted passages are from the book BOOM: Bubbles and the End of Stagnation This Annual letter expresses the personal views of the author and Montecito Investment Portfolios on the current and future economic and investment landscape, at this date. It is subject to change and is not necessarily the opinion of D.A. Davidson & Co. The information contained in this presentation has been taken from trade and statistical services and other source, which we believe to be reliable. We do not guarantee that this information is accurate or complete and it should not be relied upon as such. This presentation is for informational and illustrative purposes only and is not intended to meet the objectives or suitability requirements of any specific individual or account. An investor should assess his/her own investment needs based on his/her own financial circumstances and investment objectives. The forecast, projections, or other information generated by the author regarding the likelihood of various future outcomes are hypothetical in nature, do not reflect actual investment results and are not guarantees of future results. Neither this presentation, nor any chart or graphs within this presentation may be used, in or of themselves, to constitute investment advice. They are for informational and educational purposes only. There are risks inherent in any investment and there is no assurance that any money manager, asset class, style or index will provide positive performance over time. The investment return and principal value of an investment will fluctuate, so that an investor’s shares, when redeemed, may be worth more or less than their original cost. Real estate investments may be subject to a higher degree of market risk because of concentration in a specific industry, sector or geographical sector. Real estate investments may be subject to risks including but not limited to declines in the value of real estate, risks related to general and economic conditions, changes in the value of the underlying property owned by the trust and defaults by borrower. The Dow Jones Industrial Average is a price-weighted average of 30 significant stocks traded on the New York Stock Exchange and the NASDAQ. The Standard & Poor’s 500 Index is a capitalization weighted index comprised of 500 widely-held stocks on US stock exchanges. Companies included in the index are selected by the S&P Index Committee, a team of analysts & economists at Standard & Poor’s. S&P 500 Total Return Index is a measure of the price movement of The Standard & Poor’s 500 index and including the dividends paid by the companies in the index. S&P Case Shiller Index – a group of indexes that tracks changes in home prices throughout the United States. Case-Shiller produces indexes representing certain metropolitan statistical areas as well as a national index. GDP – the monetary value of all the finished goods & services produced within a country’s borders in a specific time period. The MSCI US REIT Total Return Index is an index that broadly represents the price and income movement of the equity REIT universe in the United States. The Index represents approximately 85% of the US REIT universe. The Barclay’s Aggregate Bond Index – includes government securities, mortgage-backed securities, asset-backed securities and corporate securities to simulate the universe of bonds in the market. The maturities of the bonds in the index are more than one year. P/E Ratio is a valuation ratio of the company’s current share price compared to its per-share earnings.